Process Mining – zoptymalizuj nieefektywne procesy firmowe
Czy Twoje procesy firmowe działają zgodnie z Twoimi oczekiwaniami? To, co na pierwszy rzut oka wydaje się proste, często kryje w sobie nieefektywne obszary i nieprzewidziane komplikacje, które ciężko wychwycić w obliczu rosnącej ilości danych.
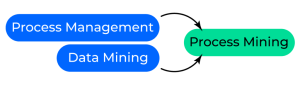
Kluczem do odkrycia i zrozumienia rzeczywistego działania Twoich procesów jest Process Mining, który umożliwia dogłębną analizę i optymalizację operacji biznesowych, wizualizuje je w czasie rzeczywistym i identyfikuje słabe punkty.
Dzięki temu możesz znacznie obniżyć koszty oraz czas potrzebny na analizę i optymalizację procesów.

Wypełnij formularz i uzyskaj nagranie
Korzyści z wdrożenia Process Mining
- Analiza procesów w czasie rzeczywistym – analizuj dane z różnych systemów informatycznych, aby uzyskać pełny obraz działania procesów biznesowych.
- Identyfikacja nieefektywnych obszarów – wykrywaj miejsca, w których procesy nie działają zgodnie z oczekiwaniami, eliminuj wąskie gardła oraz zbędne operacje.
- Optymalizacja procesów – korzystaj z narzędzi do modelowania i symulacji, które pozwalają na testowanie różnych scenariuszy optymalizacji i wybór najskuteczniejszych rozwiązań.
- Automatyczne zarządzanie działaniami – otrzymuj ukierunkowane informacje za pomocą alertów lub bezpośrednio wyzwalaj działania korygujące.
- Redukcja kosztów operacyjnych – zoptymalizuj procesy i zmniejsz koszty związane z pracą, materiałami i innymi zasobami.
Zobacz webinar i sprawdź możliwości platformy mpmX – lidera w kategorii Process Mining według Gartner Magic Quadrant for Process Mining 2024.
🗨️ Webinar jest poprowadzony w języku polskim oraz angielskim.
Michał Napieraj


Zawsze skoncentrowany na jak najlepszym zrozumieniu oczekiwań i rzeczywistych potrzeb klienta. Posiada szeroką wiedzę o produkcie oraz jego najnowszych funkcjonalnościach, którą wykorzystuje do proponowania najkorzystniejszych rozwiązań.
Przez wiele lat związany z branżą Travel, co zapewne tłumaczy zamiłowanie do precyzyjnie planowanych podróży. Pasjonat koszykówki i błyskotliwej komedii.


Lukas Stadtlander

4 Years Process Mining Experience at mpmX
~ 1 year | Specialised Sales Manager | Account Management, Strategic Clients, Customer Success, Workshops etc.
~ 2 years | Pre-Sales, PoCs, Use Case Ideation, Workshops
~ 1 year | Started in consulting & development team as a student
Business Process Management: 6 Month Process Mapping Project at a Train Manufacturer
Manual Process Mapping by interviewing people from Engineering, over Purchasing, Production Planning, Production
Transkrypcja materiału wideo
[Michał Napieraj]: Now I will switch to English. Your turn. Now, as I said, in Polish probably right man in the right place. No one I can imagine. No one who can present this tool better than the, than an experienced representative of a company who invented it. It’s your turn. Now go on Lucas and impress as many people as we saw in the questionnaire.
Many people are interested in such solutions. So go on your turn now.
[Michał Napieraj]: Yeah, thank you very much for the introduction. I also found the questionnaire very interesting because we know that many people already working on process optimization, but, and also people being interested in process mining.
But when it came to evaluating process mining, there was still like a 50 50. Decision. And I think that’s very interesting be because we see, of course, quite some adaption and that many more companies are evaluating process mining for their company and for their process optimization.
[Michał Napieraj]: You see it because you work on it, you are specializing in it.
But when we talk with our clients, with VA clients when we talk about the process optimization, they’re really interested in it and they are really willing to hear more about it. So maybe that also that’s why we organize together this webinar. Yeah.
[Lukas Stadtlander]: That’s very awesome. I think so because maybe let’s catch up a little bit also about our past and how we came to the topic of process optimization and process mining.
Yeah. I’m speaking for the company of Mework. Our product which is awarded by market leading analysts is called MPMX. So that’s how we divide. And we founded the product MPM mix, I think about eight years ago. And this came based on a demand that we were already analyzing data inside many co corporations, for example, at Eon in the auditing department and in other companies as well.
But we noted that the only the reports we provided are not quite using all the data that are existing in these organizations. So at a certain degree there was a demand to also bring in the topic of processes into data analytics. So to use evidence based on data to analyze processes and not do it all in a manual way.
With the market of process mining evolving over time. I think two years ago, the first magic quadrant for process mining tools itself was developed. And this year, the the second. Year of Gartner Magic Quadrant in process mining came out and we are glad to be a leader inside that that yeah, reports as well as in forestry reports and therefore we are, let’s say, cutting edge at deploying process mining in corporations.
And it’s very great to seek use cases at different kind of organizations. We have customers in insurance sector. We have in high tech sector. There’s also many cases in ITSM service management where there are quite difficult processes to optimize, especially with service level agreements that we need to, that we need to fulfill.
And of course, also manufacturing is a great use case where we discuss purchasing processes and production processes, which all seek the goal to finally solve all the issues when looking into these complex heterogeneous it landscapes. And yeah, that’s basically also our journey. And yeah, for today I wanted to share with you guys a little overview of how we do it and what process mining actually is.
Give you a slight life demonstration so that you have a look, look and feel how our tool works. And afterwards, given outlook to use cases of what you can do, what you can use the process mining for, so that you have it as easy as possible to adapt it and translate it into your business. I think we have a quite diverse audience today.
We all need to work together on bringing it into your into your use cases, and that’s what we want to do today. Directly jumping into the topic, what is process mining about and how did we came to it? So basically we like the metaphor of an iceberg because the iceberg usually covers two sides.
The one side that is above the surface. And it’s, it can be seen pretty easily. And I want to make an analogy here to a classical report. So it’s quite easy to have reports about, let’s say, lead time or revenue or kind of that stuff and monitor it based on dimensions, for example, for each supplier, for each company, or for each department.
And this is basically what tells us what happened. So we can say, okay the revenue went up, which is great, or it went down and we need to contact and find reasons why it went down. Or we say, okay, you need to improve. And then the department or the stakeholder has to do it on its own and try to find ways to get it up.
And same for SLA or lead time KPIs, depending on what we talk about. So this is like the current level that we usually identify in corporations that don’t use process mining yet. And their current task is if they evaluate a KPI is too bad and we need to optimize it, or we need to find out why it is so bad that they get into the discussion with the stakeholders.
But there are of course many different reasons for that. It’s not enough to know that one customer for example, has often a bad lead time because there are also many different product groups, process types, involve stakeholders in your own organization. And bringing this information all together is very complex and often a task that you can’t do alone with one, one guy going through the company and asking all these questions.
Why, for example, the SA has not been met. So this is basically what’s below the surface, all these kind of reasons, information why and how it happened and what we can do to optimize it. Finally, which is usually a task of the business process management at all, or of process optimization initiatives in general.
So for today, we want to find out how process mining helps to also discover this part of the iceberg that is below the surface and therefore enhances your data strategy and also any other digitization strategy inside your company because you have a lot of data already about your processes, but with the current visualizations and analytics capabilities, you’re not really able to use it in a way that that it can really help you.
So to ask the question, how do we get this question mark solved? How can we get below the surface of the iceberg? And therefore, I want to quickly sum up what the process modeling in the past was about. So basically if we now have a process and we have identified an issue, for example, within KPI, with the KPI, the lead time is too long.
We do, we then go to the associated department and ask the people how is the process running? Why was it slow? Why is it long? And what are the issues for that? And based on that, we try to formulate like a process map. And of course, as I am yeah, mostly limited in resources. I can only ask the most important stakeholders because the stakeholders often have a lot of work to do inside besides helping me to identify reasons for why things went bad.
So there’s not so much resources that actually have time to spend topics on defining processes. But of course, I also need to map all the information on the manual map. So in the past, I basically took some kind of paper with a pen and write on it how the process is running. And of course if we now say, okay we identified deviations or reasons where we can improve, we then tell all the people, okay, we now doing adaption to the process.
Please work like this. And after a couple of years, we see maybe the KPI goes down again. And what do we have to do? We need to analyze and a ask these people again, what did change? Why did it change? Whereas now the bottleneck, for example, in the whole process, and this is basically if we speak of companies with over thousands of employees with 200,000 or more different articles and purchases or sales orders that are need, need, that, that need to be processed.
It is not sufficient to do it based on paper, especially if we have data already available. So what we are doing with the process mining and what we are seeing here on the right side is basically how we can analyze processes based on data. Instead of asking all these people we use the information we have about the processes in our source system and map it automatically into one holistic process graph that contains all process traces that were actually done inside your source systems.
So instead of a storage model, like on the left side, that is that is created based on discussions and interviews we have like the true happening of the processes because we look on it on data. So it’s objective it can be repeated any time. So we basically. Can click on low data and the whole process map will be updated again as it really happened.
And of course yeah, it’s integrated so any kind of system can be connected to and therefore adapts to the changes that are done. And yeah, therefore we really can save a lot of time in analyzing or modeling the process. But of course, we can also dig a lot deeper into the processes itself.
And that is basically what all the topic of process mining is about and why it has such a great impact currently on the market. So what do we exactly need to come from an, from a traditional process mapping project or process modeling project to an process mining project? In general, it’s basically very simple.
So imagine we have different kind of activities. In this case we see like a purchasing process that starts somewhere at the web shop where someone enters shopping articles into the shopping cart creating a purchase order. Then inside the ERP system of the organization. Then at a certain stage there, there are goods that come in as well as an invoice.
Maybe the invoice has to be approved and finally the invoice will be paid. So these are, this is a process that goes end to end across multiple departments. Like the purchasing department is involved, a logistic department is involved. And of course there are also different systems involved. So what we do is basically identify the process steps that are interested, interesting to analyze the process in depth and end to end way.
Then we connect to the source system and identify where we can find proof inside the system about the activity and when it happened. And the only thing then we then need is like the possibility to extract this data and bring it together into one holistic event log. And this event log is like general transaction history about all tasks or activities that has been done.
And we need one object id, which is called Case ID in a process mining way that connects one one object and associated event in timestamp with the other events in other systems. So for example, in the purchasing process, the case ID would be the purchase order item ID if we, because we have the purchase order item being created.
Then we have the purchase order item being paid. So we need to see that the created purchase order item and the paid purchase order item can be mapped with one id. In a production process. We might have a material that is flowing through different stages production stages. In the insurance scenario, we might have a claim ID that is processed by different people in the organization.
So this would be the kind of ID that we need. And on the other hand, of course, we need the activities and the timestamps. And if we got all this data together, which would be the basic requirement to do process mining, we then automatically generate a graph that we see on the right side. So the graph on the right side is created based on the data that we enter.
So this means that if we change the data that are included here, for example, from a purchasing process to a. To production process, then we are able to analyze a production process instead of a purchasing process. So it’s really adapting to the data that we feed into, and therefore we can use it in any kind of process where we have data about The only requirement is that the process is digitized and that we have evidence about the process in our source system and that we are able to extract these kind of data.
So if this is. Possible. And we identified all these activities that belong together. We then can analyze the process based on the data and not on a process model mapped on a paper for example. And then we see how the most frequent process looks like, which would be like the variant in the middle.
We can investigate deviations like where are skipped steps, where are repeated steps, like loops are possible. And we can also evaluate where are bottlenecks in between which process step there was most times spent and stuff like that. And depending the more data we have, the more detailed also the process graph will be.
And this of course helps us a lot to to bring transparency into the organization and form a digital twin of a process. But what is most important? It’s really that we have this event lock and that we have a source system that carries information about the process. It can be like a ticketing tool, ERP system usually have these kind of locks.
It can be also some kind of yeah, customer journey analysis. Often used customer journey tools. It can also be a data lake where this information is stored, but we need the evidence for these kind of for this kind of information.
[Michał Napieraj]: Lucas, we can stop for a while because we have question.
So you are saying this stuff can analyze and create a solution plus alternative solutions for a certain date process from company, like some bypass of existing process.
[Lukas Stadtlander]: So yeah. Maybe I repeat. So yeah, we are offering a software that is extracting from your source system. The process will run data. And finally creating this process graph that allows you to analyze how the processes are running.
And this is based in a subscription software, which is based on users. Yeah, that’s basically the service we are offering. But we are coming to that by looking into the live demo.
[Michał Napieraj]: And one more question about how to catch start and the end of activity, because in some cases, or usually there is only one time of activity.
Good question. It’s not an obstacle.
[Lukas Stadtlander]: Yeah, it’s not an obstacle. We have different kind of activities. So in production processes, for example, we have start and end activities usually, but it also works if we have only one timestamp, it would be just an enrichment to add these kind of activities where we have them to analyze the duration of activities Also.
But it’s totally sufficient to only work with one timestamp. It still is enough to analyze where bottlenecks are and where deviations appear in the process. So basically it’s huge better flow of existing process analyzing data from core of company and, yeah, of course it is more accurate than doing it manually and asking people how the process works.
And it’s it’s done live. You can repeat the process analysis and usually you also have a huge gap between the people that know the process, how it’s implemented in the IT system, and the business people that want to optimize the process, they don’t have data knowledge. So they can use our platform to easily identify deviations that not, that should not appear.
And therefore be able to create KPIs in an ad hoc style to yeah, to boost their process improvement ideas and evaluate hypothesis. For example, in the purchasing process, they note one supplier always delivers late because he send has no other confirmations. Then they can filter for the supplier and look at the processes of the supplier and evaluate how often he work, for example, with other confirmations or not, or how many invoices he send can be different kind of questions.
The main difference is that we only need to define like all activities that, that are involved. And then the what we see is then automatically created. If you only work, like with analytics, you need to create a dashboard for each report, and you never have the end-to-end view. That’s why it’s so important, in my opinion, how initial part of the existing clause can be skipped.
Yeah. I’m not sure if I understand this question right, in my opinion. Yeah. So maybe we will jump to the next slide to catch up onto it. Of course we have how an hour to, to go more in depth and maybe things will get clearer. So what we usually identify when working with process mining that that people think the processes are quite simple on a high level.
When you think of a purchasing process, it would be like here on the left side where it says how the process was designed. You think of, okay, I need to create the purchase order item. Then the supplier creates an invoice. Then at a certain stage they come the goods, there comes the invoice, and I pay the invoice and all is done.
Yeah, that’s like the idea how it mostly gets implemented and mostly that no, no one thinks about deviations. There are some people in organizations that we work with that doesn’t even know that there are some kind of deviations because they are not so deep in the process because they have a more high fly role.
And then we come to the second part how companies think the process is running actually. So there, okay. The people that are usually involved with the process, they are aware they are. There are some deviations to the process because of course it cannot be everything streamlined because you still have some some context which is out of the organization that you can’t influence.
So there will be also always some kind of deviation. But yeah not in a way that anyone is thinking of how many deviations they actually exist because it’s also distributed knowledge. So yeah that’s basically what we can see here. So now the process mining enables us not only to look at the most frequent deviations and most frequent process path, but really on every process path that happened.
So what we see is the process, how it’s running in reality, and what we see it’s called in the process mining language, like the spaghetti diagram, because there are so many different variants and it’s so complex and that you can’t, do it with your head and evaluate it so the people actually working inside the organizations have to meet complex decisions of what to do, because it’s not as simple as you can see here.
In reality, they’re so diverse structures that need to be handled. And that’s really what we are bringing live to you with our software to analyze that and to find the spots where you can make the processes more simple and improve your services towards customers or decrease menu work necessary or decrease errors.
All these kind of possibilities we can analyze. And then you in the end what I mostly like is like the hypothesis. So you have the KPI, which says or maybe a contracting document where it say, yeah. I have a SLA of five days lead time, and basically it’s measured from start to end and in between there can be multiple other steps.
Sometimes you need to wait for a customer, sometimes there’s some o other error. And all these kind of different deviations are just wrapped into this one. KPI of lead time, but we can’t actually see what is the difference between each each agreement and each lead time. So if you want to really analyze it, we need to also, adapt to certain certain patterns that appear. So if there’s a customer contact, again, maybe it’s not right. Measure to calculate the lead time based on that. And this should be made transparent and not only within one column in a table where we see lead time, and that’s all about the process measuring capabilities.
So that’s really what we are going to do and what we provide our customers and our solution. So what do we offer exactly? So our offering is like a process mining platform process. Excellent platform. It covers the capabilities to extract data from all source system that we need to analyze the data.
It covers multiple functionalities to analyze processes in, in depth, which would be like the MPMX analytics module. So in there you can analyze bottlenecks, you can analyze automation potentials, you can analyze loops and processes. You can create BPM models based on the actual processes and stuff like that.
There’s also the capabilities for people that have low technical knowledge to filter on, on processes, so to evaluate processes for suspicious pattern that why we often use process. Mining and auditing projects, for example, to find deviations in processes. And yeah, that’s basically the analytics module.
As a next step, which we won’t deep dive today, we also cover a module which is called MPMX execution. And the basic understanding here is that we have a live monitoring of our processes. So imagine you identified as a bottleneck at a certain place in the end-to-end process. And you you identified that certain information is forgotten or not prioritized good enough.
So you provide within the MPMX analytics module an overview about all open processes and try to remind or send actions based on the data that we identify. And that is done with this MPMX execution module and some cases really. Push information back into the source system so that we really are able to cover the whole graph from process analysis to process optimization, and then process analysis again, and all in an automated way so that we can see where did we deploy an improvement to our process.
Then we execute on that and we see, again, if the improvement was successful or not. And therefore we really have a database approach, which is also correlated to Six Sigma and transformation project principles like you are familiar with.
So that would be basically the understanding of our platform, maybe to adhere the platform is in a subscription contract usually by three years. And it is offered on premise in SARS or in a hybrid model. So we can really suit it to your environment and that makes it a really flexible approach to analyze multiple processes.
Okay. So much until here from theory, let’s now jump into the live demo. Just give me a quick thing and, okay. Can you see my screen now? Yes, it’s visible. Okay, perfect. So basically where we, I wanted to pick you up is right here. So what do we have as a requirement? We need, like I already told you, we need this event log, so we have here I will quick, quickly zoom in so that you have it more easy to see it.
What I have here is like the ID of the purchase order item, the activity type and the timestamp. And based on that, the graph here on the right side is created. That’s basically what the software is doing. And now I can, by switching onto lead time, can see where is the longest time between each process step.
And we see here, okay, 318 days between create, create, purchase order item and supplier creates invoice while between supplier create invoice and record goods received. We have only three days. So this is like in a very simple approach for only one purchase order item, what you can do to analyze this process.
So what of course would be now interesting to add another process trace to this visualization. And basically now we see that there is one process graph that went this way. So one started with the event SRM created, if you can see that. So there was like an activity and the supplier relationship management tool before that.
Then both acti, both prices come together in the event, create purchase order item. And then there’s again, a deviation where all these tasks are skipped until the supplier creates the invoice. And in the middle, in the other process trace, there were quite some other activities. So this is something we can of course do for 1, 2, 3, or even more cases and add therefore afterwards more processes step by step.
But the very interesting part is now of course to not only do it with one or two processes, but for all processes that we find inside your data. So from a number of four cases that we selected, which have three different process variants, so one of these cases has the same process variant as the other ones, we now.
Clear the filter and take a look at every process that happened inside the organization. So right now we see we have 130,000 cases selected, and we see how the most frequent process variant looks like. So in this case, this is the most frequent process variant. And it starts like we just talked about with the creation of the purchase order item, supply creates, invoice, worker goods received, and so on.
If I now want to analyze what is the most frequent bottleneck in this kind of visualization, I can again filter here for the for the filter, for the lead time and see, okay. In most of the processes the longest time is between record, invoice receipt and clear invoice receipt.
So this is already an insight that most companies usually don’t have, where the most time between which process step is spent. So this could be a starting analysis for bottleneck analysis in a purchasing process. But what we also can do is switch for the most frequent process variance. So right now I get a really great overview about most frequent processes that happen inside the organization.
And what we can see here, all started with the 19 thou 90,000 and purchase order item is directly created. Then 46. So 46,000 directly go to supply creates invoice while 9,000 go to receive order confirmation and 3,500 go to delete purchase order item. So now by investigating this graph and I want to improve the purchasing process, I’m asking myself why are there after the create purchase order item 3,500 times purchase or the items deleted.
As an analyst who wants to improve the process, I now want to find out why are these why are these processes deleted? So I press onto this activity and press all processes with this activity, and now everything gets filtered and we receive all processes that involved the deletion of a purchase order item.
And we now see here when the deletion of the purchase order item happened and what was before that activity. So we see some of them had a purchase requisition item. Some of them had a receive of order confirmation. Some of them had like change events. So this could be really interesting to identify what led to the deletion of the purchase order item.
And we also investigate that we have reactivation of purchase order items again, so quite interesting way of a flow that first one gets deleted and then reactivated again. And this must be a pattern that can’t be very efficient. So I’m filtering on that again and have now all purchase order items that were first deleted and reactivated afterwards.
And now I’m making use of additional context information like company or spend area, for example, to find out in which type of my organization this pattern usually appears. And I can now directly get in contact with the packaging and ask him why this is happening and make an associative improvement so that this won’t have Megan in the future.
So this could be like one insight that we get by using our process mining solution. By just clicking a few times without having to pre-built any KPI that analyzes deletion of purchase order item and reactivations. Of course, this can be done for multiple other steps as well. So if I now imagine I want to filter for certain pattern because I know that in the process it is not good.
For example if the supplier creates an invoice before we receive the creation of the purchase order item, and I now want to evaluate how often does this happen. So this basically means I will clear the pattern that when the supplier creates the invoice before a purchase order item is created inside the system, this means that it cannot be, that the supplier negotiated valid contract terms. So it could be that, that the supplier has a contract. But the business department did not use the contract because it would only appear in the purchasing apartment after the purchase order item was created. This pattern is also called maverick buying.
So based on this on defining this pattern here, in this drag and drop way, I’m not now able to identify every process where the invoice creation happened before the create purchase order item. So now I press applied ferry and all processes get directly selected, and I’m able to find out how often this pattern happened how much lead time it spent, how many different variants there are, where this pattern appeared.
And I can directly contact the supplier, for example. In this case, the legal GMBH, why? It isn’t, why it behaves in that way. And this can be also like a way for non-technical people to filter for a process related KPIs based on data. And not only talk to people and ask them, for example, how often is it that you create a invoice before the purchase order item is created?
There’s basically not an existing report or otherwise the report has to be built. And this is very, a very complex task. So with the process mining, we are able to identify that based on data during a discussion. So imagine you discuss process improvement and you can filter within this discussion how you can improve the process.
And by reducing these kind of patterns that you don’t want to have in your process can be a very efficient way. So one other option that I want to show you is that we can identify bottlenecks in the process and filter for them as well. So for example we know that supplier creates invoices.
And on the invoices there’s usually like a target deadline. So they say when I create the invoice, you have 30 days of time to pay the invoice, and afterwards you will get some you will lose some discount or you get a bad flag or whatsoever. So in this case, we want to find out how often the supplier created the invoice.
But the invoice received at, in our site was like several, like more than five days after that. So we are able to identify if some supplier is yeah, is so that we have to pay earlier than we have because the invoice was coming in so late. So in this case I defined supply creates invoice and every case that takes longer than five days will will be filled up if I click this button here.
So by doing that right now, identify that there are actually five 88 cases where this is the case. So I am able to spot every time where the time between these two activities was longer than five days and can directly pinpoint which supplier is doing this kind of pattern and maybe get in touch with him or in contact with him to resolve this pattern for the future.
So that is really something that provides. Hundreds of different analysis capabilities without a pre definition. And so we are really able to identify how a process can be optimized with a database approach and not with a with a discussion storage feeling approach. So this would be like a first look into the platform.
We offer many more different process perspectives that we can analyze. So I already mentioned that we can analyze bottlenecks based on that, but we can also analyze like automation possibilities, rework possibilities, and we can benchmark processes. But that would be something that can be discussed or shown in a deep dive or in another session.
I now want to present you some use cases that we already implemented with customers where. The real value comes out of, out, of these kind of analysis and therefore I’m switching back onto the slides if there are no further questions until this point.
Okay. So how, what are the results that our customers achieve when they use process mining? So right now I’ve been showing you many use cases of the purchasing process. So example, for example they notify the great impact on billing processes where they are really able to spend or to reduce the resources involved.
In, in billing processes and be able to save really a lot of money there as well as, for example, invoice to cash processes. So where we also talk about the billing at the pharmaceutical company, where we investigated that the billing of certain customers was too late. We also had like internal procedures that said certain invoices should be blocked.
That should usually not be blocked so that the people always had to ask for approval to pay this invoice even though it should, it would, it was valid invoice clearing and therefore we investigated a huge saving, potential calculated on a year. Also use case that you often have is of course in order to cash.
So the other side where we want to identify where are bottlenecks in the receiving of payments and our invoice creation. So if we wait too long to create invoice, we have a longer time where we wait for the money and the longer the time we wait for money will never come back to us.
So that’s a great factor to also improve the operations and have already a direct finance financial impact if you use process mining on these finance related KPIs. And also we have a production company. So in production use cases, the topic of maverick buying and that I already showed you business departments are purchasing stuff or material without using framework orders of the general purchasing department. And based on that, there usually is also great loss and detected. And this also can be part of a process optimization process done with process mining because it’s much more simple to identify these pain points and actually directly say, okay, if we reduce this based on the data in the next year we’ll have a waste reduction of 1 million euro if you are able to pay all the invoices in time more if you always are able to use framework contracts.
So that’s really where also the IRI of the process mining solution come from and what we can do inside these projects. If excuse me.
[Michał Napieraj]: Look, because we have two questions. One of them is from port. Could you give another example of process to optimize, but I assume that you are doing it right now, but may, I’m not sure whether P meant the showing it via live demo or is it okay what you do now? Is it possible to make root cause analysis in MPMX?
[Lukas Stadtlander]: So yeah, I start with the second one. Yeah, we have a root cause analysis included. This can be also AI based, but what we basically do is we bring all together all hypothesis and insights and then it automatically calculates which of the these root causes are the most frequent ones that suffer or make the process suffer.
So that is actually a use case. And exactly like the other question. This tool helps to visualize and analyze the processes based on real processes. And it’s helping you to make improvements, to make changes and to reduce. Usually we also have like finger pointing when discussing of processes.
Imagine like typical discussion between a purchasing department and invoicing department. If the purchasing department does not do everything right in the system, then the invoicing department also always have to carry out on the mistakes. The purchasing department. And like usually they are like, no, it’s your fault.
No, it’s your fault. And based on the data, these discussions end because you have a truth in the middle. And both take a look on it. And then finally the purchasing department is, oh, that’s really dumb, because now I see how often that’s an issue there. So let’s for the future make it like that. And you can always see if what you discussed makes sense and improves in the future, or if it actually is not improving the problem.
[Michał Napieraj]: And we have any interesting question about what does MPMX have to do with click?
[Lukas Stadtlander]: So yeah, basically if your company has click in place we can just install it within click send. So you don’t need to purchase what the data already is. Yeah. Yeah. So you don’t need to purchase like a separate server.
It’s fully integrated into that and you can use your existing knowledge for MPMX as well, but for any other one without click. It’s also fully capable to achieve everything I show today. Inside your operation. It is a full blown process mining platform.
[Michał Napieraj]: Yeah. But KRA is also asking about the other front end reporting tool.
Can it be used together with PMX?
[Lukas Stadtlander]: So yeah, we have possibilities to embed with other reporting tools. Yeah, we have customers that have other reporting tools like power BI for example, or IBM Cognos and we integrate like the KPIs they already have with the process process related view.
And yeah, that’s also then the one is more for the standardized reporting and billing procedures. And the other one is the more for the process related KPIs. So that’s how we use it.
[Michał Napieraj]: And we have two, two more questions from Voytek. So we about loop and rework, and
[Lukas Stadtlander]: yes, we also have loop and rework analysis.
I quickly went over that within the solution. So it gets automatically detected and you can, within this patent search, you can also search for loops in the process. Usually what we also do inside ticketing processes is, for example, to analyze jumps between different departments.
So if you see first one department was assigned, then it goes to the other one again, and then it goes back to that. You can fully filter for that and identify how often this happens and why it happens.
[Michał Napieraj]: The last question is about the demo version. So it’s possible, let me answer it. I was about to tell you about it at the next part of the webinar, dean of the webinar.
But we, as the data wizards, are an exclusive partner for the Polish market for MPMX. So if you want to get the demo version, you can contact me and we can talk about it. Sure. Very nice.
[Lukas Stadtlander]: So yeah, for the last couple of minutes I want to present you a few, outlooks of how you can use MPMX.
So basically it is everywhere possible where you have process data and processes implemented. So we call that the value chain. So every value related processes. The processes usually generate value, which you can build towards towards clients. And based on that anywhere there where such efforts are and the data are available, we can make use of it.
And yeah, the typical areas are provided here, like production, we have the great use cases of production companies that analyze their production processes as well of as all supply chain related. Use cases like we also have many logistic use cases. So for example, the company of ING that analyze their warehouse picking routes.
You were able to see when did a certain package in the warehouse get picked, and what did you pick afterwards? How much was the time in between that and then they investigated. Oh. Some articles that are usually picked together have like over a hundred meters in between them. So why do we don’t, why don’t we put them together so that he doesn’t need to run a hundred meters to catch both of these articles and this kind of analysis, which of course is obvious when you see it.
But if you don’t have something that provides you with transparency, how should you get the idea to build exactly these two measures that identifies this kind of analysis and the process money really helps you. To explore what is happening and what could be an issue and have a, yeah, a transparent, a glass that you can pinpoint and or like a scope that you can use for a certain problem.
And then afterwards the get into a a deeper deeper dive and evaluate this kind of improvements. So yeah, for the companies that are more from a ITSM view we also often analyze ticketing processes. I already mentioned that in insurance sector, especially like claim management data.
So there are many different departments and specialists involved when evaluating if a claim is valid or not. And also we use these companies use a lot of automation. And possibilities and PO potential. So these are great ways to identify where are processes already automized and where do we have still a lot of manual efforts or manual steps that we need to fulfill.
So there are also process mining helps to analyze the parts that are fully automated. So one, you can make it quite simple who is looking at the automated parts of the process, if not a tool, like a automated process analysis because yeah, nobody will check frequently or sit beside a RPA bot, for example, and see how he’s working.
So that really provides possibilities to get transparency and to boost your automation initiatives. And of course we have customer journey examples like for example, in telco companies where they’re interested to yeah, provide best service to the client. So every error, like for example, my internet got disrupted just 20 minutes ago, so this is very bad internet experience for me.
And I noted for myself, yeah, we need to change the contract. So they want to avoid these kind of things for customer satisfaction. And if you have more and more of these bad experience as a customer, you might more you might jump off to another telco company for example. So these kind of analysis are also very interesting and revealing to identify patterns that yeah, that can be avoided and to also see where are happening things in parallel, for example.
So yeah, I think there was like one, one other question. Yeah, so it is, so we analyze the processes that are implemented in real, like ERP processes, like transactional systems. And we can use of course pro business process models like in BPM and notation or like reference models to map them against them.
So we can see, okay, this is the model, how you designed it, and this is how it’s done in reality. And then we can compare between the S is model and the two B model and then make adaptions to it. So whether one has to be adapted to the reality or the other one to the SS model.
So this can be something that we can work with.
[Michał Napieraj]: I will have one more question about the specific production sector. So if you could answer it.
[Lukas Stadtlander]: So yeah, I’m working in food production sector process issues are discussed quite frequently. What is your experience in this sector? So I am, I quickly summarized it, but let’s jump onto it.
We have a food production company. As a customer. They are producing like frozen food basically everything that comes out of potatoes. And they really analyze like the warehouse picking roots inside inside the warehouses and identified yeah, as I already mentioned, where are longer routes, where can I optimize my whole layout of the solution.
As you can see here on the screenshots, we have the possibility to not only analyze the process. Based on the activities that happened, but also based on geographical or layouts. So you can only not only get the control flow perspective like which is more on the order, but also like where did it happen.
So for example, what we often do is try to evaluate if you need in a production process or in a warehouse process a different mes another mesh, like to decrease a bottleneck, for example, and make the process more fluent. You can evaluate with process mining how much it would help and also simulate if you use another machines.
At a certain stage if you have, for example, one, one mes for food cutting and there’s often a bottleneck behind or in front of that me, you can evaluate, okay, how much of that how much will it bring me in if I replace that mission or if I add another mission.
And these kind of things can be of course also done with ERP modules. So if I want to enhance an existing ERP system with another tool that provides me an integrated possibility or an automated possibility. Just jumping onto this example, one question,
[Michał Napieraj]: I know the answer, but I want to emphasize it.
If you can switch to the previous slide. Yeah, sure. As I understand using this factory map or. Or company map you can using the last or last, so functionality in click sense, select specific elements of this process.
[Lukas Stadtlander]: Yeah, exactly. So I can focus also like on Yeah, as I said, on the geographical parts of the process.
So only because, let’s say so at certain stage this could also be departments or different warehouses or production sites even. So imagine one time in the company in Poland is producing some goods and the other time in Germany. But still it would be, in both times it would be the same activity, but of course the whole complex.
Or the whole process has different specs then because there are different route for the material to go different the delivery times, and these, let’s say supply chain use cases are also very revealing and to use process mining for and all other related data that work into that. So was this a good answer or was this clear how these two technologies me together at this stage?
All right. So one, I have a couple of more, but this one I want also want to highlight. So what you can also do is use the process mining to analyze yeah. Improvement initiatives. Like for example, you have an EP system and you ask yourself right now, I want to upgrade this ERP system with a certain functionality.
There can be different kind of ways to do it. I al already mentioned automation can be some kind of way, but you can also purchase like a another ERP module and it basically says, okay, for example some kind of tasks are now integrated. There are, for example, carriers that help me in the printing of labels and therefore this should optimize my, my packaging process by a liter reduction of 50% because.
Then I am I achieved my return on investment because yeah, of course we know anyone promises the best numbers and the best goals, but in the end, if you implement it, you want to ensure that it’s really working as expected and that it’s also adapting to your processes. So you can compare, for example, all processes before you implemented that new process module and after you implemented it.
And if you implemented it well, we of course want to hope that the lead time went down. As you can see here, we have here like a medium lead time of six days and it went down after the implementation to three days. And especially where it does this integrating part and that I mentioned, we have a go down between certain two steps in the process from one hour and 24 minutes to 19 minutes which is calculated over a year.
Of course, a great time saving that you can use. And in this case it was a successful project. But of course there’s also things to evaluate in a deep dive. So maybe not all processes can yet be done with this new module or there’s also some kind of or some department or some. Some locality or subsidiary that should, must be enabled yet or must be helped to to use that new module as well.
And therefore you can also evaluate where do I, where should I implement it next because there are also many orders that are done manual, for example, and then afterwards see how will it improve for the future. So really getting a data centric approach here to evaluate all kind of improvement initiative.
And it’s only a matter of what you want to use it first because I think we both are convinced that this will be a topic of a future, especially if you also think about gen AI and all these possibilities that you have and therefore you need well, described processes that are smooth and what is happening at which time to be ready for these other technologies.
So that would be basically a first introduction. For today we offer like the possibility to try out our solution within within workshops. If that is interesting to you. We basically need from you an idea of what kind of process you want to analyze or what kind of use case you, you are interested in.
And then we can yeah, make like a session. But I think Michelle will have you in informed about how to contact us and how to get another deep dive. Yeah, I think we can wait for a couple of questions or Yeah, you can continue Michel as you want.
[Michał Napieraj]: Okay. So I’ll speak to the q and A slide, but as I assume we.
We asked most of the questions when they appeared, but if you have some questions, you can ask them now. We’ll answer them before we finish.
It’s in, in German.
I think it, maybe it should be toy.
[Lukas Stadtlander]: I don’t know why you came to the conclusion.
[Michał Napieraj]: Just kidding. We can talk about the price.
[Lukas Stadtlander]: Yes. So yeah, maybe if some of you are still inside here I, of course would be interested of how well you understood what we are doing with process mining and how we evaluate, this kind of technology for your for your operations do you think you have the necess information necessary to do this kind of analysis and yeah, that would be interesting.
[Michał Napieraj]: Okay. So Lucas, I assume that this is the end of the questions, at least for now. Yes. I will switch for a while to, to polish to finish and to give the contact.
Okay SIC no more questions. Lucas, I think it’s time to say goodbye. Thanks a lot for your attendance and for your presentation and we keep in touch as always.
[Lukas Stadtlander]: Definitely thank you for attending today